

How to Use App Reports
See number of downloads and how visitors are using the app
[embedyt] http://www.youtube.com/watch?v=w8df8dQ8k5c[/embedyt]
Now that your app is live, you will have access to two different types of reports. App Figures reports and User Reports on the App Builder Website give you insight into your apps’ download numbers as well as how the app is being used. Below is a detailed explanation for both types of reports.
App Figures Reports
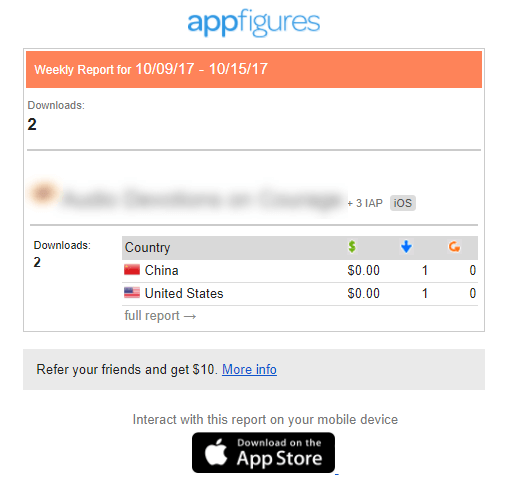
Within a week of both your iOS and Android app of being published, you will receive weekly e-mails from a third party service called App Figures. App Figures Reports pulls directly from the Tour Buddy developer account. Inside the e-mail it will provide a download count for that week. You can click on “Full Report” and see the following information:
- Total number of downloads
- Filter by device type (iOS or Android)
- Filter by date
- Show download numbers from specific countries
- Revenue earned (if app is paid)
App Useage Reports
Reports on the App Builder Website give you analytics of user behavior inside the app. These analytics show which stops are the most popular and how long users are spending in each stop. Filters for the date give insights into usage throughout the year.
Single Guide Reports
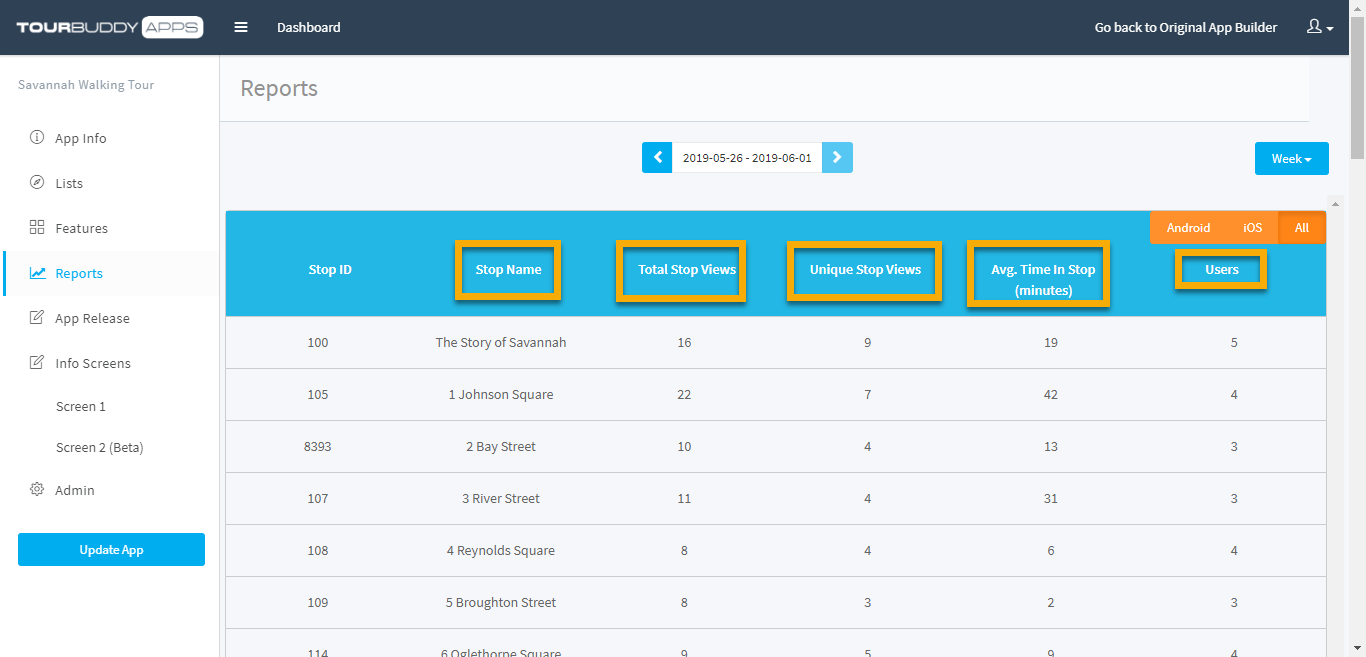
Below is a screenshot and an explanation of reports for a SINGLE guide app:
Week/Month Filter Button
Use this filter to quickly show the usage in the app for the week/month. Once you choose the week/month view, then you can filter the dates for the week or month with the date filter above the ‘App Info’ Section. All of the data you then view will be filtered by the dates you selected.
Total Stop Views
This is how many times the stop has been viewed, which means the user clicked on the stop. If the same user clicks on the same stop, leave it and comes back, this is counted as 2 views even though it is the same person.
Unique Stop Views
This is how many times the stop has been viewed by a single user. These stop views only show the first time a user has clicked on the stop. The Unique Stop Views does not count the same user clicking around on the same stops. That is why it is titled as ‘Unique’ because it only counts the first time a stop is viewed by a user.
Average Time in Stop (Minutes)
This is the average number of minutes users are spending in each stop.
Users
The number of users who have viewed that stop.
Tips: You can press any of these filters to view the list from highest to lowest. For example, if you want to see which stop users are spending the most time in, you would press the ‘Average Time in Stop’ to see the highest to the lowest.
Multi-Guide Reports
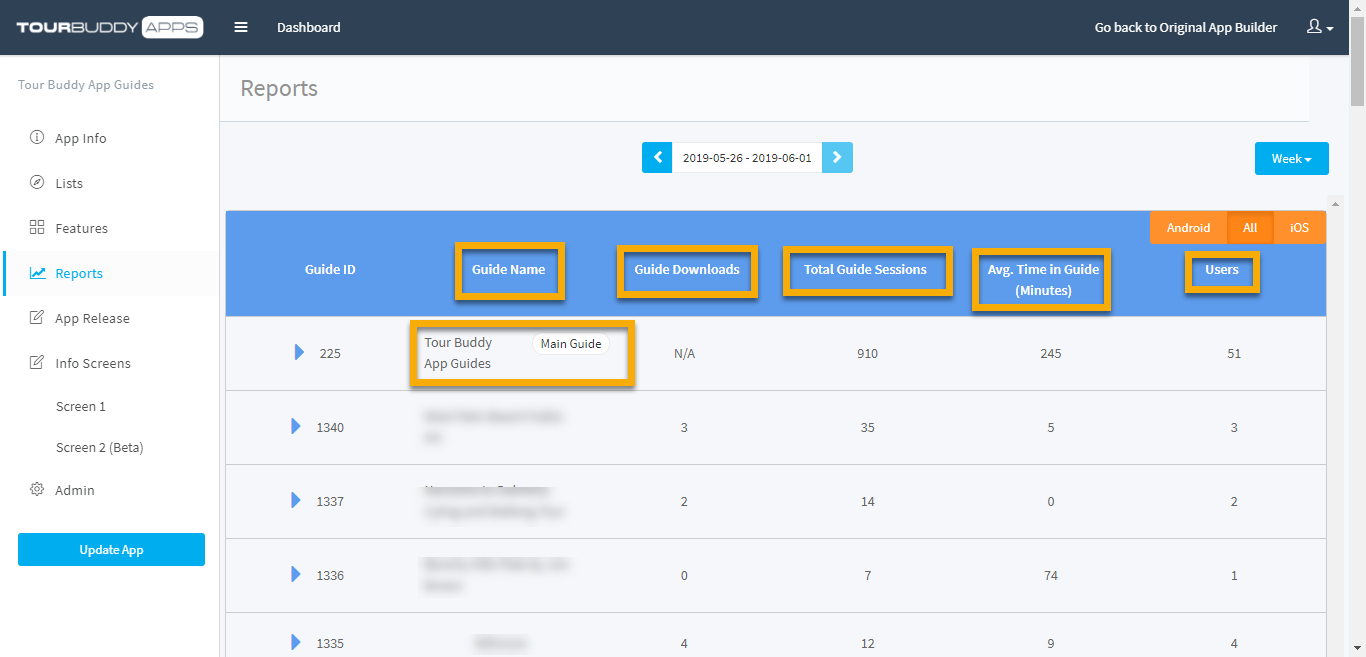
Below is a screenshot and an explanation of reports for a MULTI-guide app:
App Info
Guide Name
The main guide is the first guide on the list. This is the guide that ALL of your users will download. The list of guides below the first guide are all the attached guides.
Guide Downloads
Number of downloads for the specific guide. (The overall guide downloads do not display for the main guide, only the child guides).
Total Guide Sessions
Number of sessions the user spent in the guide. If they are in the guide, close out and come back to the guide, this counts as 2 sessions.
Average Time in Guide (minutes)
The average number of minutes that all the users spent in the attached guide.
Users
Number of users who downloaded AND opened that specific guide.